infographic

SUSTAINABLE TRANSPORT SURVEY PRESENTATION

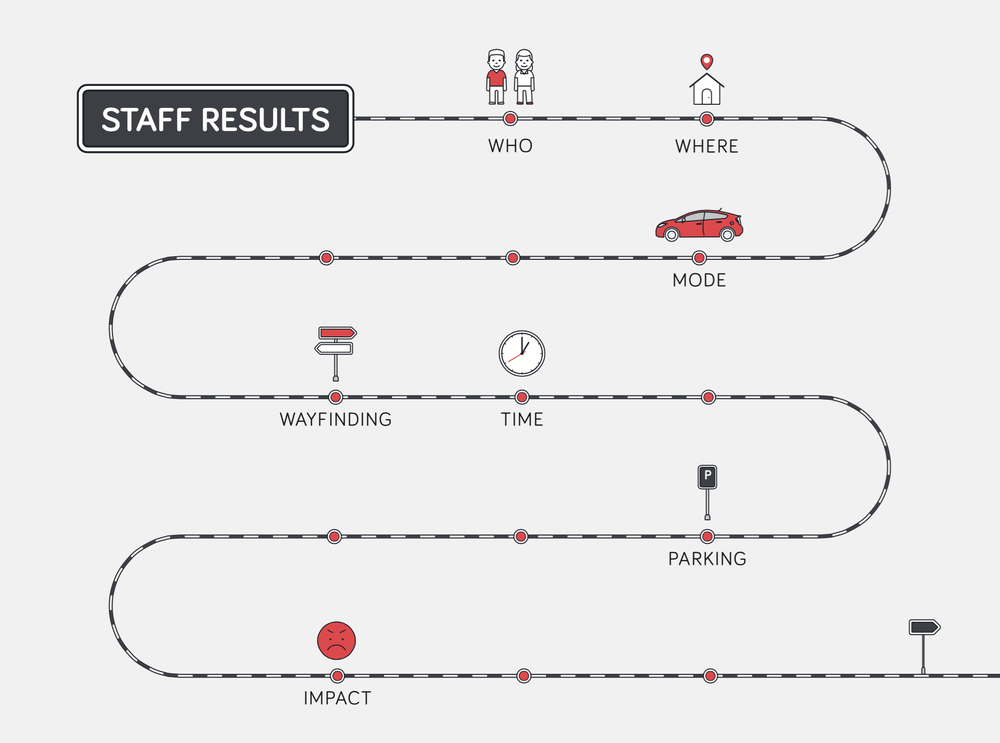
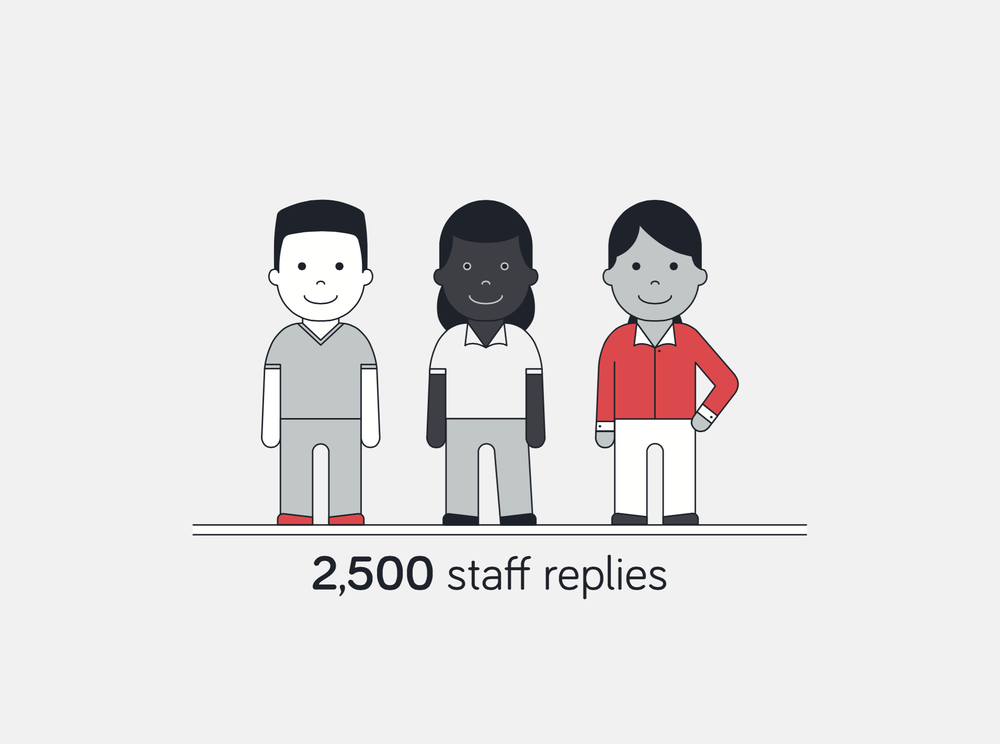
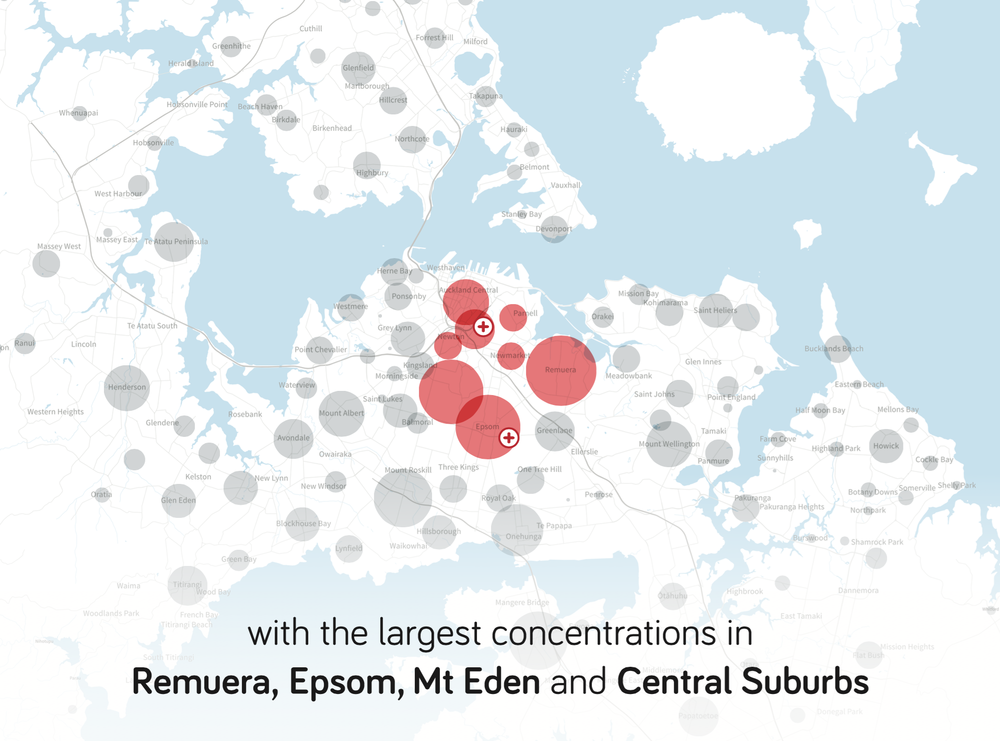
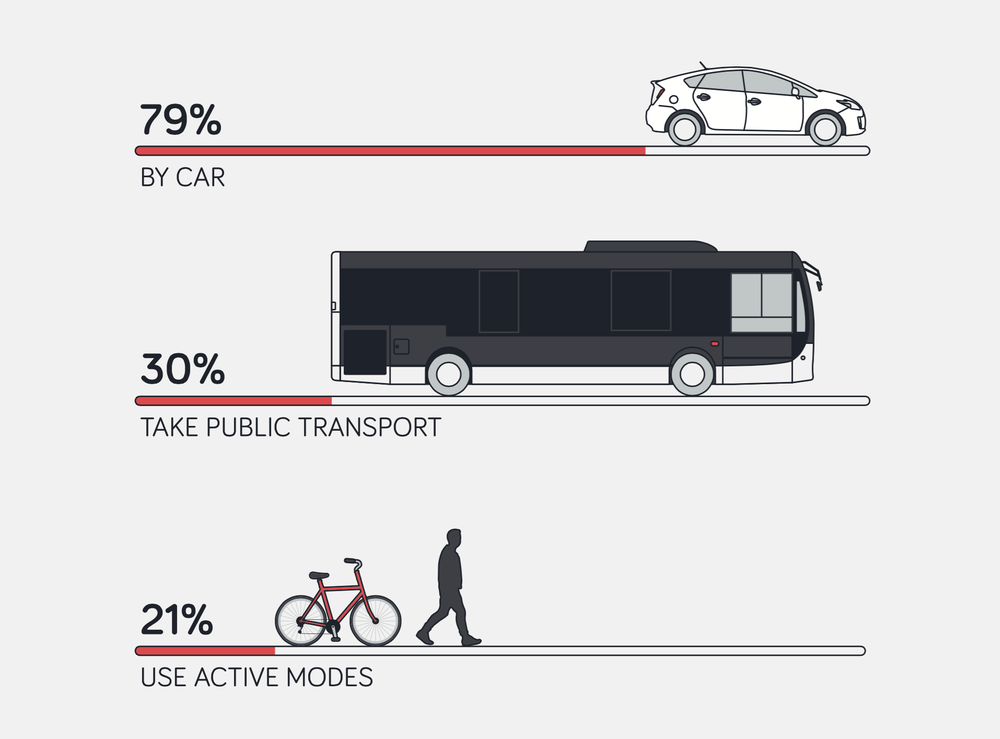
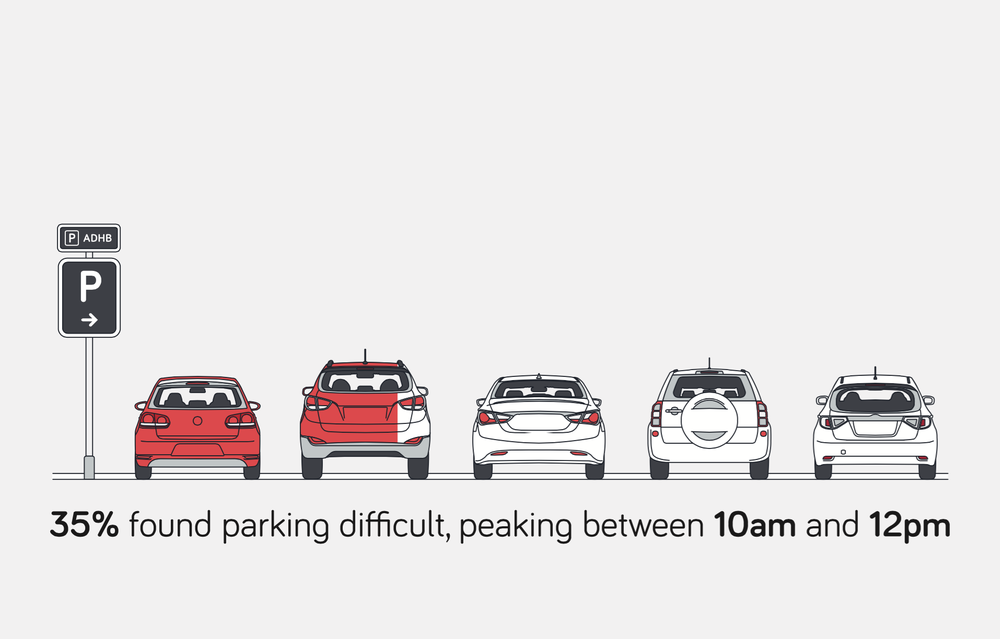
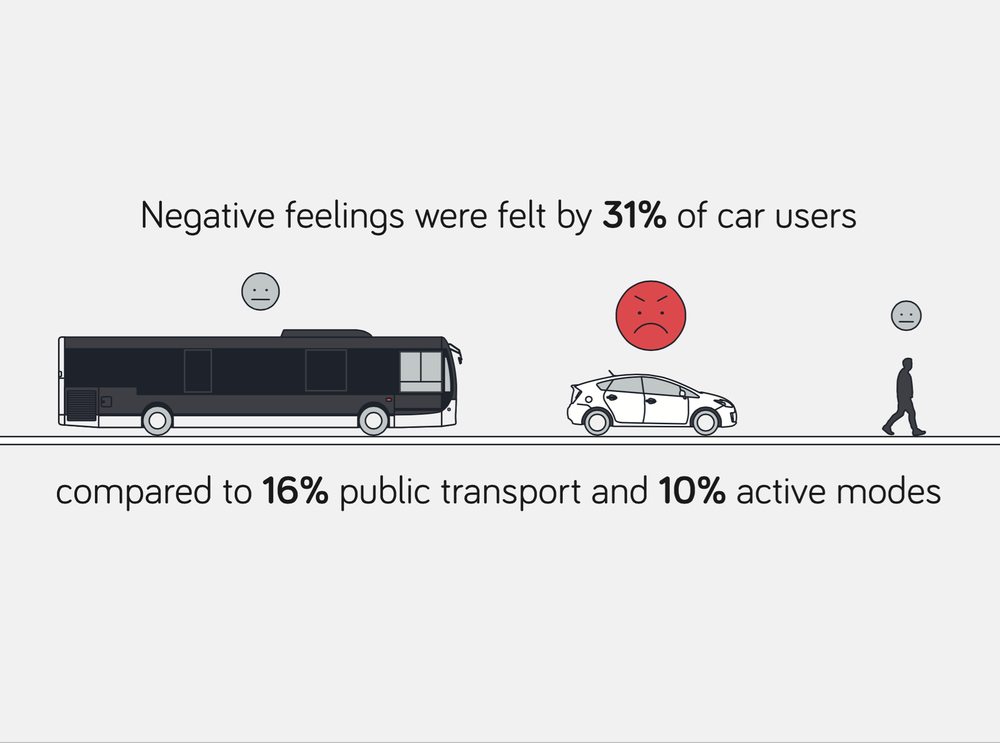
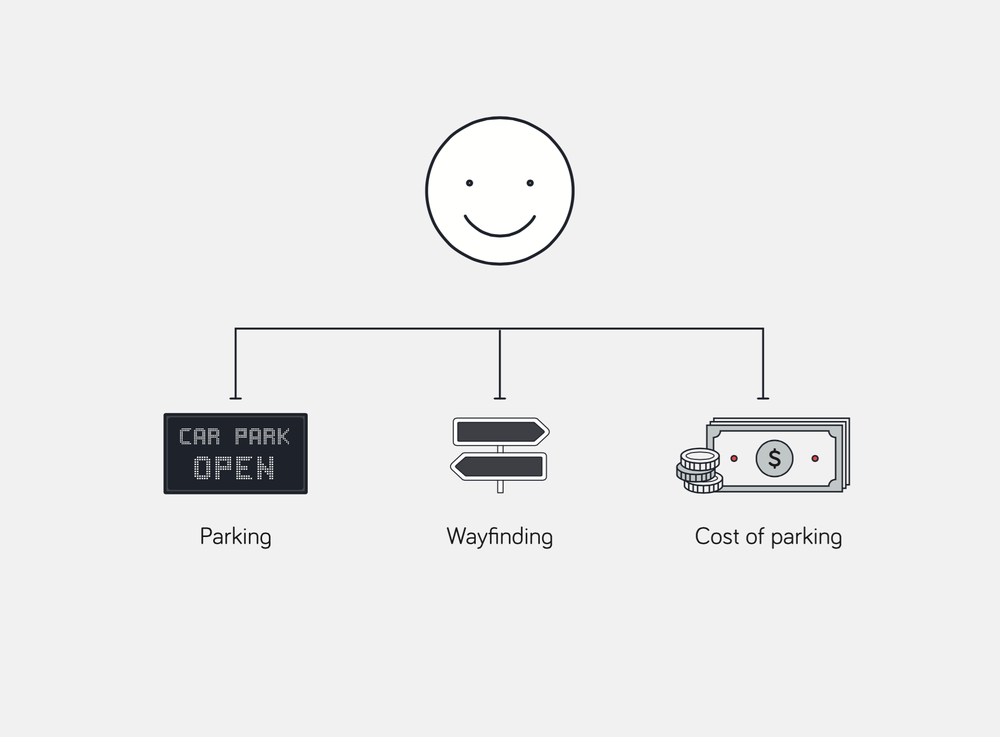
As part of the Sustainable transport and Urban Design Seminar, the lab put together and infographic presentation to illustrate the ADHB Sustainable Transport survey results. Working closely with project managers Ian D'Young and Phil Schulze the presentation aimed to present the data in an engaging and thought provoking fashion, in contrast to conventional spread sheets and graphs. Take a look at a few screen shots below:Screen Shot 2015-04-29 at 10.08.33 am Screen Shot 2015-04-29 at 10.09.01 am Screen Shot 2015-04-29 at 10.09.15 am Screen Shot 2015-04-29 at 10.09.59 am Screen Shot 2015-04-29 at 10.10.07 am Screen Shot 2015-04-29 at 10.10.18 am Screen Shot 2015-04-29 at 10.10.29 am Screen Shot 2015-04-29 at 10.10.43 am Screen Shot 2015-04-29 at 10.10.53 am Screen Shot 2015-04-29 at 10.11.07 am Screen Shot 2015-04-29 at 10.11.18 am Screen Shot 2015-04-29 at 10.11.44 am Screen Shot 2015-04-29 at 10.12.10 am Screen Shot 2015-04-29 at 10.12.20 am Screen Shot 2015-04-29 at 10.12.31 am Screen Shot 2015-04-29 at 10.13.13 am Screen Shot 2015-04-29 at 10.14.15 am Screen Shot 2015-04-29 at 10.14.29 am Screen Shot 2015-04-29 at 10.14.42 am Screen Shot 2015-04-29 at 10.15.20 am Screen Shot 2015-04-29 at 10.15.27 am Screen Shot 2015-04-29 at 10.15.47 am

See the full presentation here:

STP Survey Presentation