The hospital is constantly collecting out data and measures all day, everyday. This data may appear in reports or graphs of performance, but is largely unseen by the the hospital and its users.
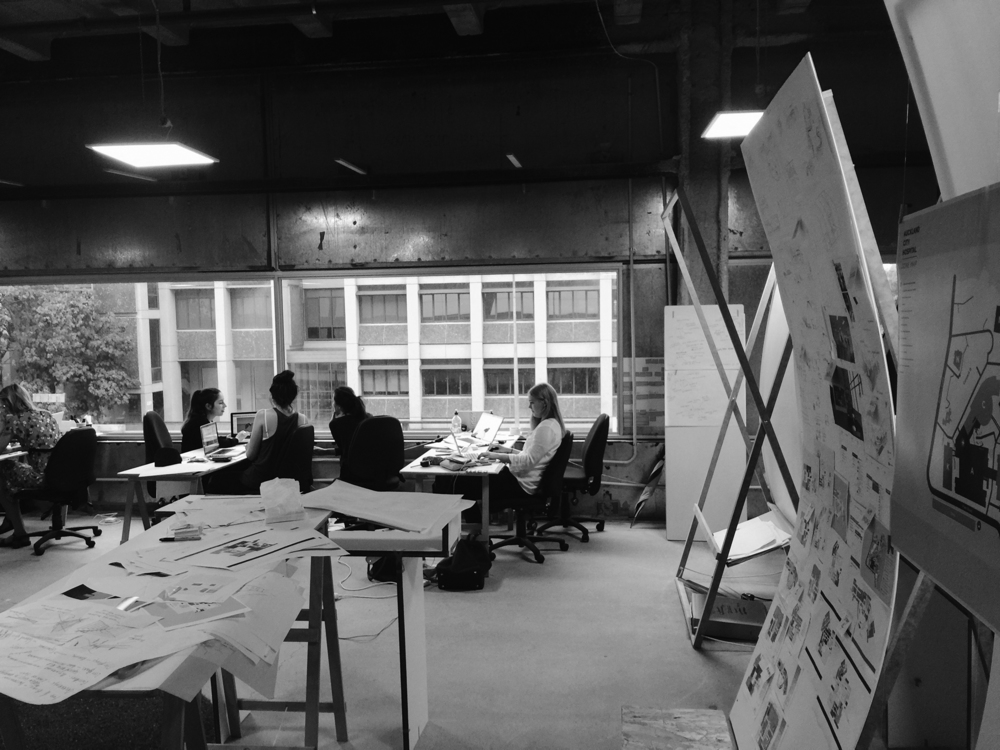
As a part of the summer studentship running a the DHW lab, students have been asked to consider how data might be made more accessible through creative installations and artworks. Check out the brief they have been given below:
You have been looking for a partner in commissioning an abstract data driven visualisation of what’s going on in real time in our hospital in our public spaces. The data is real time information as being fed from our hospital information showing things like admissions, discharges, transfers, diagnostic orders (labs, radiology), dispensed medicines, surgeries, outpatient visits and other sorts of transactional data. We would be looking to apply patient lenses to this information such adults, children, women, ethnicities, localities, conditions (cancer, diabetes, mental health) etc.
You would see these visualisations continually running 24/7, and include disruptions into the visualisations for exceptional events such as births, deaths etc.
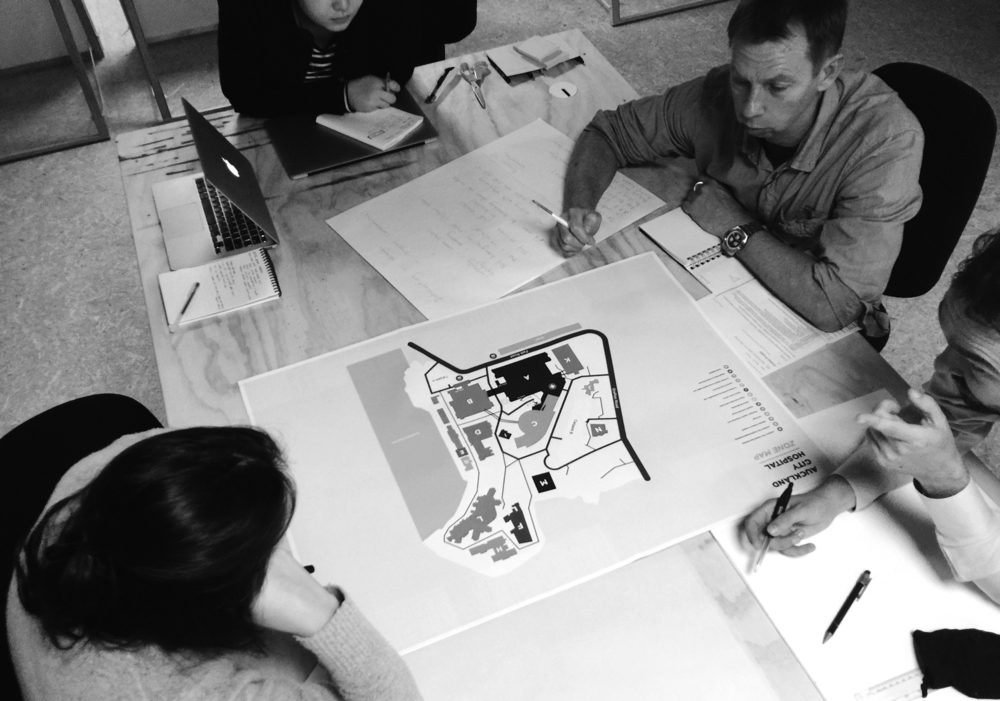
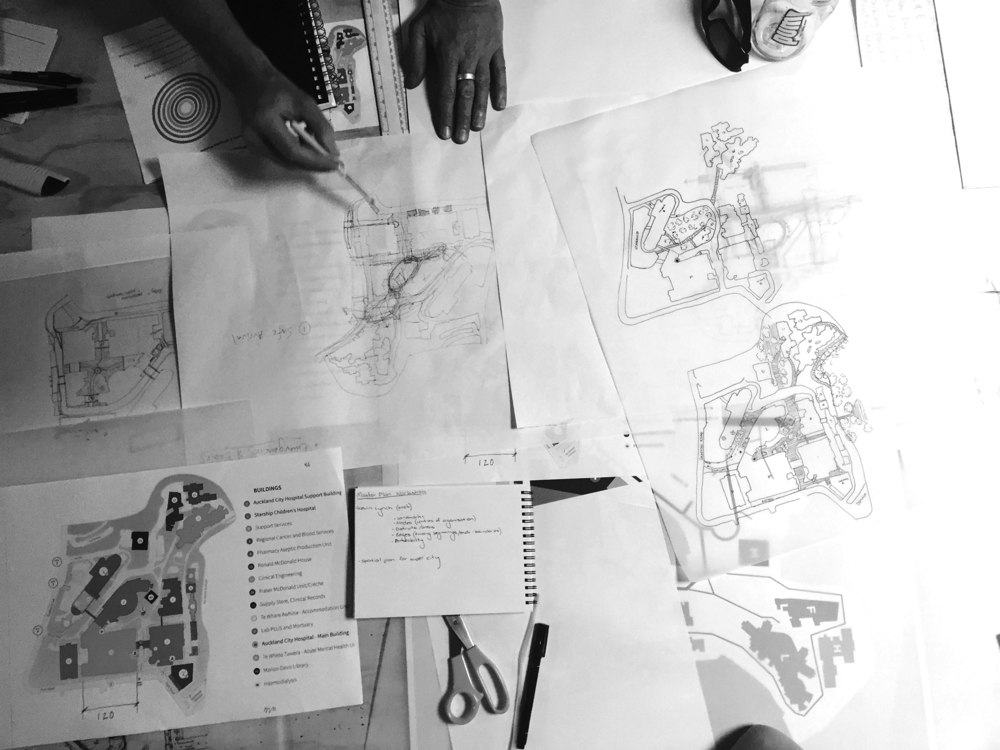
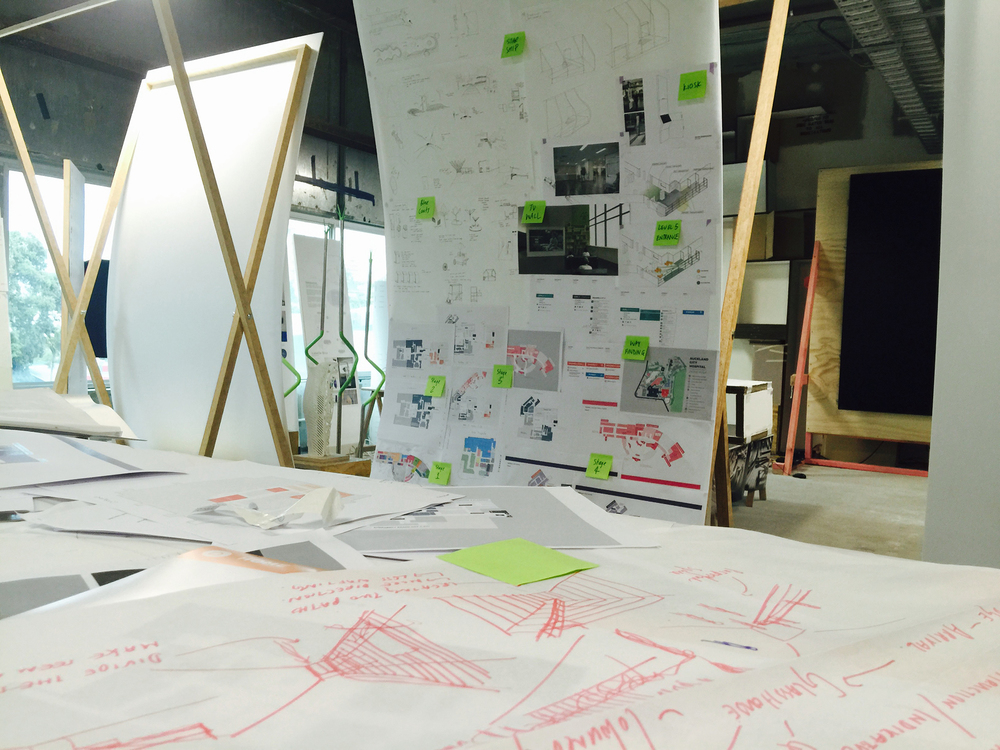
We recently ran a workshop with the students to introduce the brief and explore:
What type of data could be used?
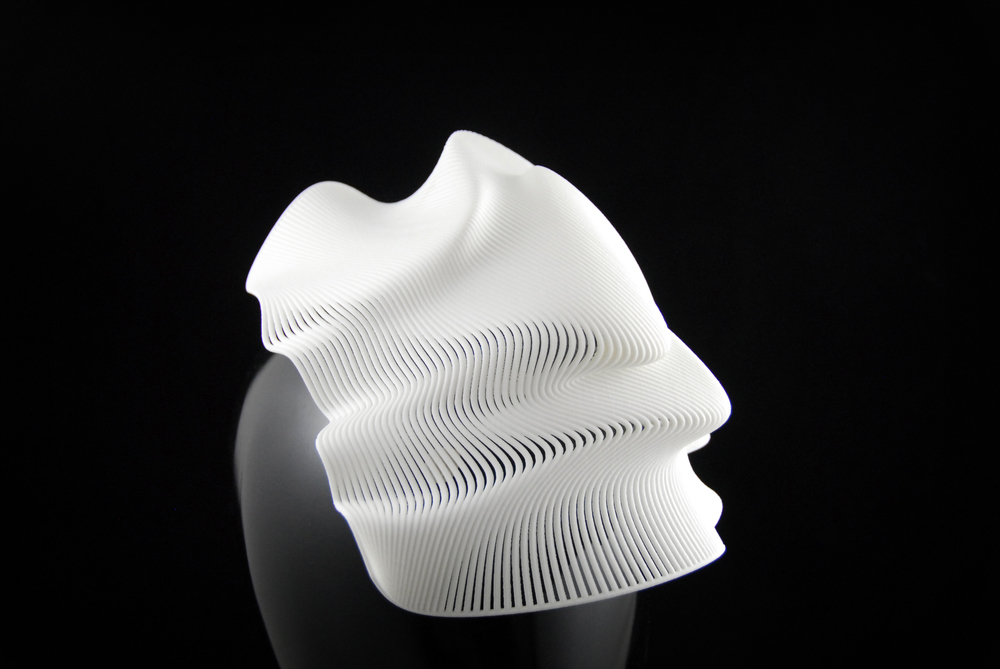
What mediums could be used to present this data? Sound? light? objects?
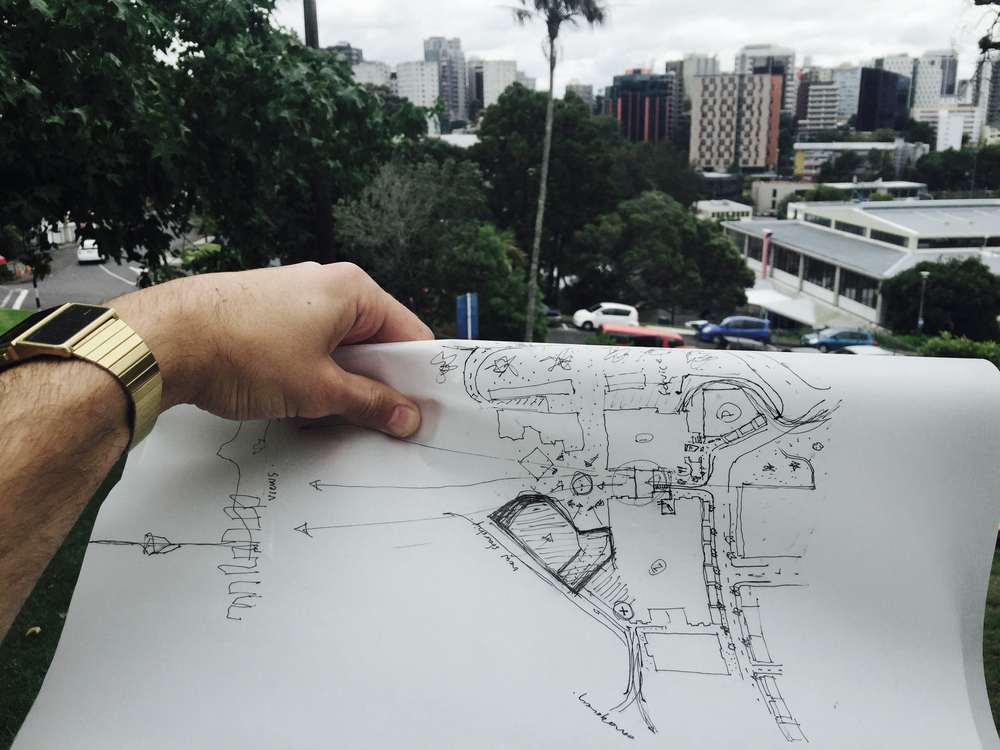
Where might these installations be placed int he public spaces?
Stay tuned for updates on this project...

